 RSS Feed
 Twitter
Daily Winners and Losers


The New Zealand dollar is the top
performer against the greenback with an advance of 0.52% at the close of
European trade. Broader market sentiment remains well supported with
risk assets taking a reprieve from the heavy selling pressure seen last
week. The NZD/USD rebounded off trendline support dating back to March
of 2001 at 0.7550 with daily RSI reversing sharply after reaching
extreme oversold levels not seen since August of 2008. Daily topside
resistance now stands with the 78.6% Fibonacci retracement taken from
the mid-December advance at 0.7680 and is backed by the 61.8%
retracement at 0.7850. A break below trendline support eyes the December
lows at 0.7460.
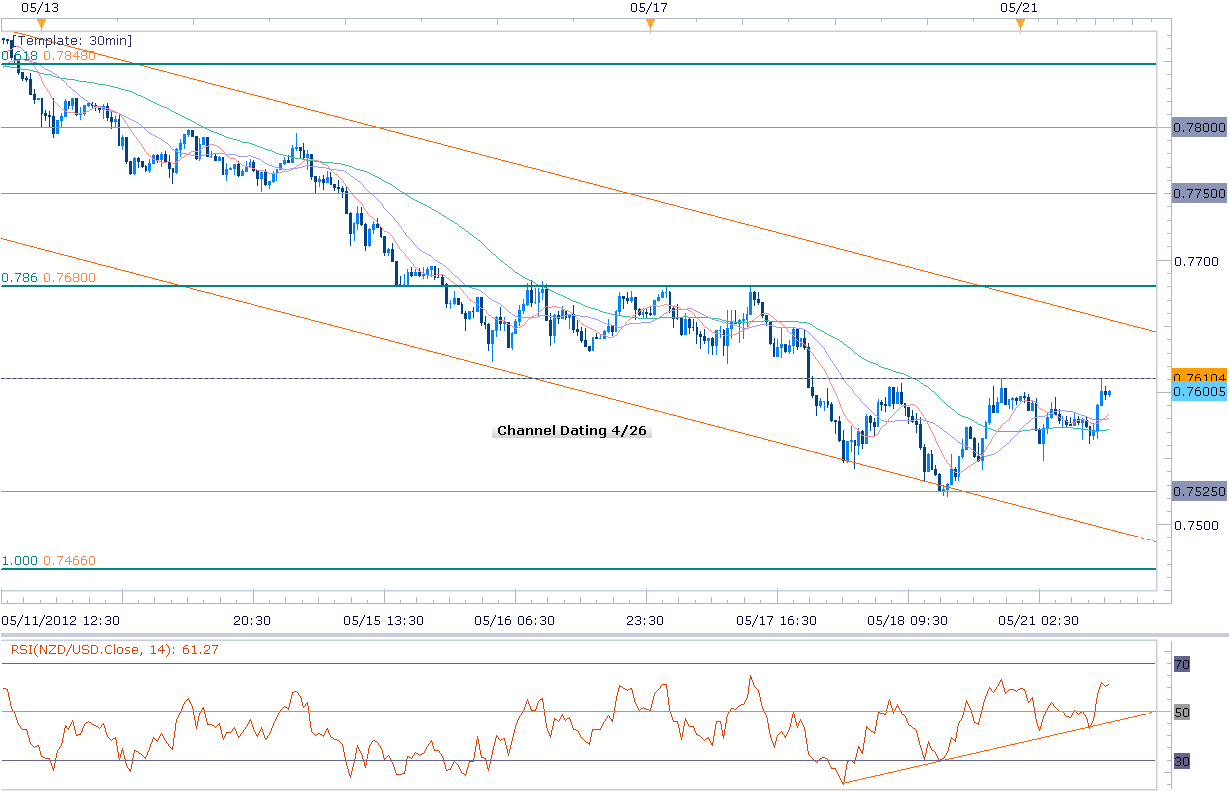
The scalp chart shows the NZD/USD
continuing to trade within the confines of a descending channel
formation dating back to April 26th with the pair currently holding just
below interim resistance at 0.7610. Look for the pair to remain well
supported at these levels amid a rebound in broader risk appetite with a
likely breach above this mark eyeing topside targets at channel
resistance, the 78.6% Fibonacci retracement at 0.7680 and 0.7750.
Interim support rests at 0.7525 backed by the December low at 7460.
Key Levels/Indicators
|
Level/Indicator
|
Level
|
|
200-Day SMA
|
0.8021
|
|
100-Day SMA
|
0.8130
|
|
50-Day SMA
|
0.8075
|
|
2011 NZD LOW
|
0.7108
|

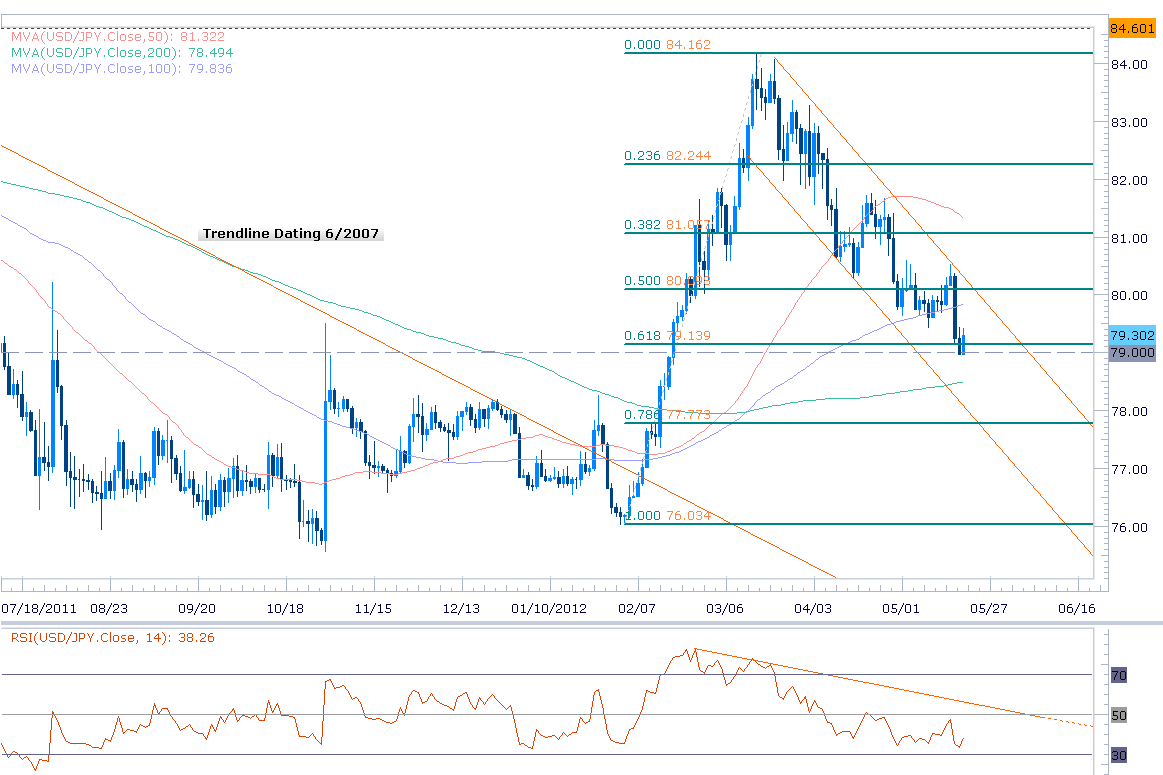
The Japanese yen is the weakest
performer against the dollar with a loss of 0.38% in US trade. The
USD/JPY rebounded sharply off the 79-handle with the pair continuing to
trade within the confines of a flag formation off the March highs. As we
noted earlier in the month, our medium-to-long term bias remains
weighted to the topside with long entries favored between the 200-day
moving average at 78.50 and the 61.8% Fibonacci retracement taken from
the February advance at 79.15. Initial daily resistance stands at the
confluence of the 50% retracement and channel resistance just above the
80-handle with only a break below the 200-day moving average negating
our directional bias.

The scalp chart shows the USD/JPY
holding just below the 61.8% Fibonacci extension taken from the March
14th and April 20th crests at 79.35. Initial topside targets are eyed at
the 50% extension at 79.80 and channel resistance. A break above this
level offers further conviction with subsequent resistance targets seen
at the 38.2% extension at 80.30, 80.55 and the 23.6% extension at 80.85.
Interim support rests with the 79-figure backed by the 78.6% extension
at 78.75 and 78.50. Note that while trading conditions in the yen are
not conducive to scalping, we are long a fourth of our typical trade
size at the figure with our initial objective eyed above the 80-handle. A
breach above channel resistance would suggest that the correction off
the March highs may be complete with such a scenario likely to see
accelerated losses for the yen. A shift in broader market sentiment in
the favor of risk appetite would likely be the catalyst needed for the
topside break.
Key Levels/Indicators
|
Level/Indicator
|
Level
|
|
200-Day SMA
|
78.49
|
|
100-Day SMA
|
79.84
|
|
50-Day SMA
|
81.32
|
|
2011 JPY HIGH
|
75.55
|
—Written by Michael Boutros, Currency Strategist with DailyFX.com
To be added to Michael’s distribution list, send an email with the subject line “Distribution List”
Learn forex trading with a free practice account and trading charts from FXCM.


0 yorum:
Yorum Gönder
izle, indir, yükle